Last year, following an article from raspberrypi.org's Blog I decided to support the project of these teenagers and pre-order a kit on Tindie.
A few months later, I indeed received the board (v1.2) and the sensors. In the meantime, the design had changed (some of the sensors too) and if everything works, the lack of calibration on analogue sensors make them almost useless.
Code is sometimes a bit messy (actually a sort of mashup from Adafruit examples), and two things are surprising on this project: The active main loop (without sleep) which mean that the microcontroller is busy 100% (hence becomes hot) and the fact the temperature sensor is bang above it!
But hey, I should have investigated more before and after all it got me started thus I can't really complain.
So I decided the use the card but aside from main board. It will be outside the box and linked by a ribbon cable.
Sensors installed on the Airpi board
BMP085
- Temperature + Pressure
- I²C
DHT22
- Temperature (unused) + Humidity
- Specific 1-wire protocol
LDR
- Light sensor
- Via the ADC MCP3008
Microphone
- Noise
- Via MCP6283 (op-amp) and ADC MCP3008
MiCS-2710
- Nitrogen Dioxide (NO2)
- Via the ADC MCP3008
- Datasheet
MiCS-5525
- Carbon Monoxide (CO)
- Via the ADC MCP3008
- Datasheet
Python 3
The main sections were rewritten to Python 3. For example, py-smbus for which I found a patch on a forum or Adafruit DHT.
RRD
Once again, data will be stored using RRD.
Main difference with gas and electricity readings is the use of Gauge datastores since values here are not counters nor rates.
Depending on the values, sometimes I keep the min and max for the day, sometimes I don't.
RRD creation parameters
rrdtool create temperature_in1.rrd --step 300 \
DS:temperature:GAUGE:600:0:U \
RRA:AVERAGE:0.9:1:24 \
RRA:AVERAGE:0.9:6:35064 \
RRA:MIN:0.9:288:1826 \
RRA:AVERAGE:0.9:288:1826 \
RRA:MAX:0.9:288:1826

rrdtool create pressure.rrd --step 300 \
DS:pressure:GAUGE:600:950:1050 \
RRA:AVERAGE:0.9:1:24 \
RRA:AVERAGE:0.9:6:35064 \
RRA:AVERAGE:0.9:288:1826

rrdtool create humidity_in1.rrd --step 300 \
DS:humidity:GAUGE:600:0:100 \
RRA:AVERAGE:0.9:1:24 \
RRA:AVERAGE:0.9:6:35064 \
RRA:MIN:0.9:288:1826 \
RRA:AVERAGE:0.9:288:1826 \
RRA:MAX:0.9:288:1826

rrdtool create light_level.rrd --step 300 \
DS:light_level:GAUGE:600:0:U \
RRA:AVERAGE:0.9:1:24 \
RRA:AVERAGE:0.9:6:35064 \
RRA:AVERAGE:0.9:288:1826

rrdtool create nitrogen_dioxide.rrd --step 300 \
DS:no2:GAUGE:600:0:U \
RRA:AVERAGE:0.9:1:24 \
RRA:AVERAGE:0.9:6:35064 \
RRA:AVERAGE:0.9:288:1826

rrdtool create carbon_monoxide.rrd --step 300 \
DS:co:GAUGE:600:0:U \
RRA:AVERAGE:0.9:1:24 \
RRA:AVERAGE:0.9:6:35064 \
RRA:AVERAGE:0.9:288:1826

rrdtool create noise.rrd --step 300 \
DS:noise:GAUGE:600:0:U \
RRA:AVERAGE:0.9:1:24 \
RRA:AVERAGE:0.9:6:35064 \
RRA:AVERAGE:0.9:288:1826
Having set up a sensor for both gas and electricity, the next step for me was to store the data.
There are countless solutions available for this either local or remote ("in the Cloud").
Probably the most famous one is Xively (which used to be COSM and before that Pachube). Trouble is they went really commercial without any offers for small projects. I tried a few alternatives but decided that I didn't want to publish my data and therefore turned to a local solution.
There are loads of possibilities for data storage, from the classical SQL solutions (MySQL, SQLite, ...), NOSQL solutions. A system which is gaining popularity is Graphite and its Whisper database. In the end, I decided to go for the simplest and probably most used database in the world of monitoring: RRD.
RRD
Almost all opensource monitoring and reporting tools on this planet use RRD. It has a big avantage, the database never ever grows! You lose the details (and even the data) over time but with the right setting this wasn't an issue.
For me, its biggest drawback is that (except with Datastores as 'Gauge') EVERYTHING IS A RATE PER SECOND.
Some calculation is necessary first to convert the pulses into actual usage, then into a rate and when displaying into a meaningfull usage figure.
Gas
Counting
1 pulse = 10 dm3 = 10 litres
Easy... Well how do I store this?
First let's chop the time into 5 minute slots (this the usual base for RRD BTW) and let's count the pulses within a slot. At the end of the slot, one can push the number of litres:
rrdtool update gas.rrd 1407153600:100
Displaying
Internally, RRD will not store the value 100 but 0.3333333333 because it is 100 per 5 min or 100 per 300 sec.
When consolidating (to a 30 min = 1800 sec period), RRD will average all the rates.
If I want to display the gas usage over a given period (5 min, 30 min, 1 day), I then need to multiply the value returned by the length of this period. Resp. 300, 1800, *86400.
A lot of people convert the values into Watt-Hour. Unfortunately the conversion is NOT straightforward and depends on a Correction Factor you can only discover a posteriori on your bill or if lucky on your provider website like this one. Cubic meters are OK for me.
- Power (rate): litre/s
- Energy: m3 per period
Electricity
Counting
1 pulse = 1 rotation = 3.6 Wh
Like for Gas, we slice the time into the same 5 minutes slots and count the pulses within a slot. But remember that RRD stores rates per seconds. So to make sense we have to convert the Watt-Hour in Watt-Second:
1 Wh = 3600 Ws
3.6 Wh = 12960 Ws
Hence 1 rotation of the disk equals 12960 Ws. RRD will automatically store the value in Watts!
Displaying
- Power: Watt
- Energy: Wh for display per period
RRA
As mentioned before, RRD stores the data in a way which means the values will be aggregated over time and you'll loose the original individual values. After thinking a lot about what to do and how to handle it, I settled for the following pattern:
- Step = 5 min = 300 sec (default anyway)
- Base RRA (storing Primary Data Points ):
- 2 hours => 24 rows
- Mainly for debugging and for "realtime" view
- 1/2 hour resolution:
- 2 years = 2 * 365 * 24 * 2 => 35064 rows
- Main view
- 1 day resolution:
- 5 years => 1826 rows
- Archiving as well as daily summary
RRD creation parameters
rrdtool create gas.rrd --step 300 \
DS:gas_usage:ABSOLUTE:600:0:U \
RRA:AVERAGE:0.9:1:24 \
RRA:AVERAGE:0.9:6:35064 \
RRA:AVERAGE:0.9:288:1826

rrdtool create electricity.rrd --step 300 \
DS:electricity_usage:ABSOLUTE:600:0:U \
RRA:AVERAGE:0.9:1:24 \
RRA:AVERAGE:0.9:6:35064 \
RRA:AVERAGE:0.9:288:1826
Now the gas meter has been connected... would there be any chance to do the same with electricity?
Not easy bordering on impossible
A lot of solutions (specially American & British ones) use current transformers clipped straight on to either the live or neutral wire. These can give real-time and very accurate readings. Trouble is, on french installations, both wires are usually combined together in a outer plastic sheath and in the "worst" case not even visible at any point!
Playing within the fuse box not being a great option the only remaining possibility was to "read" the meter itself.
All modernish counter have at least impulse (usually a LED) output. Some more recent even have a "teleinformation" serial communication system, not even talking about the latest generation of smart meter with a USB port).
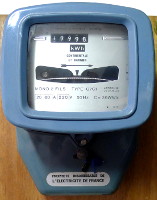
Mine is a very old rotating disk without any kind of bells and wistles... in short the worst case scenario.
After a bit of research I found what could potentially be the needed part: Fludia FM250. Unfortunately it doesn't seem to exist anywhere else.
Knowning that my meter could be upgraded at anytime by the electricity provider, I wanted to stay on a cheap and low key solution. Some people on Jeelabs forums mentioned the TCRT5000 also saying that they didn't have much luck!
But googling this reference leads to IR Sensor TCRT5000 for Arduino as well as a TCRT - Infra Red reflectivity sensor + break out board from Ciseco which mention on their website "Revolving or tumblimg numbered Electricity meters".
Having found a "Infra-red reflective distance sensor Module tracing line" (basically a TCRT5000 + LM393) on eBay for a grand total of 6€, I decided to give it a go.
Never give-up!
To cut the story short... it works! I tried first in 5V then in 3.3V and in both case the black line could be detected but...
- The alignment with the wheel is a real pain
- Hooking physically the circuit on the meter box is also a real pain
- Tuning the detection level is tricky
The temporary setup (made of cardboard and sellotape/scotch tape) has been in place for quite a while but I will need to find a better system before the next meter reading by the company.
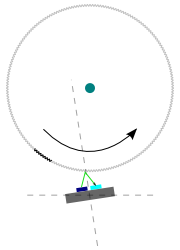
It is worth mentioning that the detection is better (or simply working) when the sensor is installed at an angle as illustrated below.
Crashing
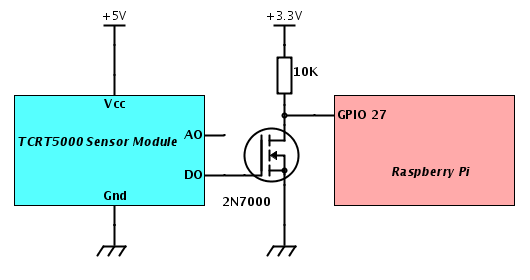
I noticed that sometimes the LM393 (part of the module) crashed and stopped detecting the black zone. It seems that the component doesn't like having its output forced to a voltage. When the Raspberry Pi boots, there is no garantee that the GPIO will be in INPUT mode and voltage free. So, to separate the two, I inserted a transistor (a 2N7000 I had in stock but it should be similar with a NPN). Moreover, it gives the possibility of using 5V for the sensor as if 3.3V should work, in practice it is relatively unstable.
And counting...
The counting set-up on the Raspberry Pi is the same as the gas one. That said, there is also a form of bounce (not mechanical but the result is the same) and so far I haven't managed to completely get rid of it, specially when there are bogus pulses a few seconds apart. I capped (like for the gas) the delay between pulses but this potentially means that I loose accuracy when the disk is spinning very fast.
So accuracy might not be that great but so far it still gives a pretty good picture of the electricity usage and with such a cheap design, it doesn't really bother me.
Schematic
A few month ago, the gas supplier changed our meter for a new one (NPL 12/110 Gas Meter). Nothing fancy, still non-smart but with the possibility of connection for remote reading.
I found a compatible device referenced TD027825 but wasn't keen in spending almost 40€ just for this.
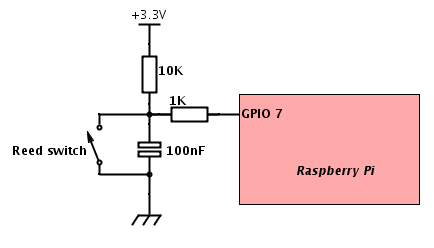
I ended up buying some cheap reed switchs on Ebay (~ 3€ a batch of 4) and it worked! Every time the last digit of the counter reaches '5', the switch closes and is released when the counter reaches '6'.
Hooking it on the Raspberry Pi
Using a free GPIO pin (#7), it was just a matter of detecting low pulses. Using a simple while loop, it worked first time!
But a loop is not a really option when one wants to deal with several synchronous and asynchronous events. Trouble started with the use of the callback mode.
RPi.GPIO now having a bounce parameter, it should have been easy to ignore the reed switch bounce. And actually this seemed to work well at the begining. Then I started to notice that the counting was usually out of sync. Mainly going too fast on the raspberry side.
For example, the meter would count 160 litres while the Raspberry would return anything between 150 and 300! After extensive research, it turned out that I had to deal with 3 differents problems:
- switch bounce when closing (rare and always within short timing ~10ms)
- switch bounce when opening (often and usually within long timing ~200/300ms)
- interference -- my cable is quite long and not shielded -- (variable)
Serious measures were needed...
Improving acuracy
First I added a 100nF capacitor which helped a lot but was not enough. Then I introduced a bit of intelligence in the process with a tick/tock system:
Both going up and down events now call the event function.
- When going down, i.e. the notch on the digit '5', the function is called and if the pin is still properly down then we set the register to 'tick'. Any other case is ignored.
- When going up, the function is also called and if the pin is properly up and the register on 'tick' then we consider this is a 'tock' and add 1 to the counter.
With this mechanisms almost all the bounces and spikes are stopped but there are still cases when it is counting too fast, especially when the wheels are turning very slowly. There is a hysteresis on the reed switch but nothing is perfect.
To filter further, a delay has been added. Since it physically impossible to have 10 litres used in less than 5 seconds then any pulse happening too soon after another is rejected as bogus.
I can't guarantee an accuracy of 100% but so far so good!
Schematic
⇇
«
Page 4 / 4