Following the upgrade of my electricity meter (from rotating disk to latest generation of smart meter), I am now able to use the Teleinformation output (hurrah!)
Linky
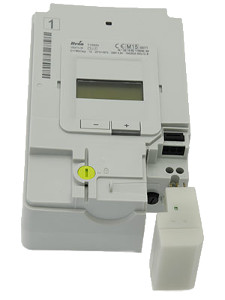
The Linky smart meter has a slot for a "LRT" module and a 3-pin header for teleinfo (the traditionals "I1" & "I2" as well as a power source named "A").
There are also two communication modes available: Historical (the only one available so far) & Standard (i.e. the new one starting with Linky).
LRT
The "Linky Radio Transmitter" (Emetteur Radio Linky) is a module developed to transmit the value to a household display. Specifications show they can be using either Zigbee or KNX. It was supposed to be totally open but I am yet to see a schematics of it.
At least the Interface Specification is available. I reused the name of Zigbee attributes for the MQTT publication.
Teleinfo
Official docs are available (in french) on Enedis's website, in particular NOI-CPT_02E for Teleinfo in general and NOI-CPT_54E for Linky in particular.
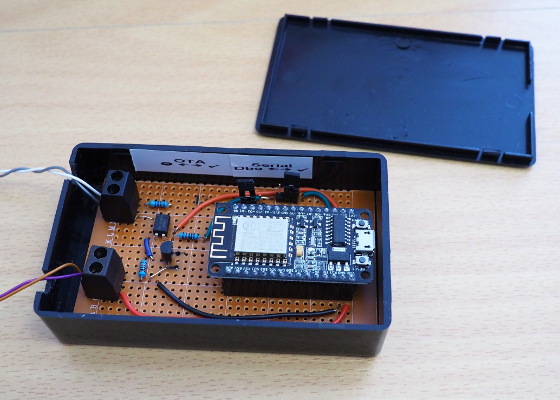
My board is vague cousin of Charles Hallard's Wifinfo but where most of the components are already embedded on the nodemcu module.
CH340G (USB to UART)
Something worth noting is that CH340G seems to be struggling with 7N1 (7 bits instead of the usual 8). Although it doesn't matter for day to day usage of the ESP8266, it makes tests (emulation of the Teleinfo frames) more difficult.
It could be the driver though I am using Linux. Using boards (Amica) based on CP2102 or FT232 didn't show any problem.
Power
From the meter
In theory, the pins "A" and "I1" are maint to be used as the power source. That said, the characteristics are 6 Vrms (50 kHz) and 130mW. This is far from the ESP8266 requirements (~ 150mA) and if it would be easy to rectify and smooth the current, a storage system (super cap or battery) would be needed to deliver peaks of currents every time the data is published (re-charging being one while module is in deepsleep).
External 5V source
To keep things simple and since I already had a 5V source at my disposal, I used the embeded regulator on the nodemcu board (through the Vcc pin but it could have been through the micro-USB socket).
OTA
Having the circuit permanently plugged to the meter means that the option of remote updates is a big bonus. The module is off/asleep most of the time so the best method was the HTTP Server one. But in order to make things easier and more secure, there is a physical jumper to allow OTA or not. When jumper is on open position, no OTA is possible. In the other position (closed), every time the program starts (i.e. every minute), it checks if an upgrade is available.
This is were the additional python script comes handy. By running a webserver and comparing the MD5 checksum of the firmware on the module to the one on the server, it is possible to launch the upgrade sequence only when necessary.
MQTT
Selected data is transferred using the MQTT protocol. As mentioned above, the names/topics used are based of the ones in the ERL/LRT documentation.
Since the tariff is a constant one and not a differential one, there is only one reading to report and there is no need to advertise which tariff is active. People dealing with Heures Pleines / Heures Creuses would have to change the code.
Deep sleep
In order to reduce the amount of power drained, reduce the heat production and because there was no need to keep the module on for nothing, I decided to turn the wifi off. But it turned out that it isn't as straightforward as it initially sounded. Just calling the corresponding fonctions doesn't really make any difference in term of power consumption and forums are full of examples looking really like black art.
On second thought, I decided to go to the deep sleep route which turned out to be easier to implement and perfectly adapted to this kind of usage. The teleinfo is continuous with values coming all the time but having a refresh every second or so has very limited interest. Even everything minute is kind of luxury.
The only downsides of deep sleep are the need of a physical wiring for reset purpose and that the programme really resets every time. In this case where the bridging is stateless (state/info is held by the smart meter and given every single time) it doesn't matter the least.
Next version
This version has been running for a while without any issue. Once the meter is properly registered by the supplier (they seem to have technical issues actually), they should be able to change the mode to "Standard".
This new mode is only in Linkys, uses a different serial speed (9600N7 instead of 1200N7) and provides more information. The "codes" are slightly different too.
There is no physical modification needed and everything is documented so making the software changes should not be too complicated.
Will see....
Code
As usual the code and schematics are available (AS IS) on github.
Back after a hiatus of a few months. The main reason can easily be guessed from the previous post! :-)
This time I will be talking about so-called "Smart meters" since both my antiquated electricity meter and gas meter were recently replaced.
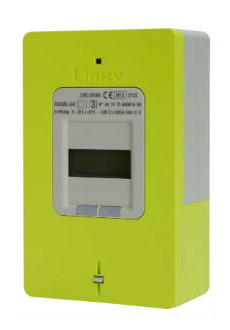
Linky
Linky is the name for the French electricity smart meter. They are manufactured by different companies but all have exactly the same flashy green colour!
Linky is highly controversial but not for the right reasons IMHO. Opponents seem to concentrate on false and bizarre statements about radiations when they don't assert the meter embarks a camera!
Long term loss of job (meter reading people) and above all the risk of privacy breach (it is technically possible to know how much electricity is used in real time hence to know what are people's daily routine and/or if they are on holiday, etc...) could have been causes worth a battle. But honestly opponents only managed to discredit themselves and look like a bunch of lunatics!
Let's not forget that the original reason behind the arrival of smart meters is (by extension with smart grids) to be able to better handle the production of electricity by "green" means (wind, solar, ...) which are highly unpredictable and require to collect real time usage to try to balance production and consumption.
The fact you can now be charged with real amount rather than estimates and you don't have to be home any more to open the door is a real bonus too. Note that in France, contrary to some countries like the UK, you don't have a "smart energy monitor" in standard. This kind of display with the current consumption in currency seems to be given only to the poorest families. AFAIK there isn't any similar solution sold yet.
There is a slot for the emitter module ("ERL") and "Teleinfo" is available! Hurrah!
So my first task was to create a MQTT/Wifi module to transmit the real time data. I'll give all the information about it soon.
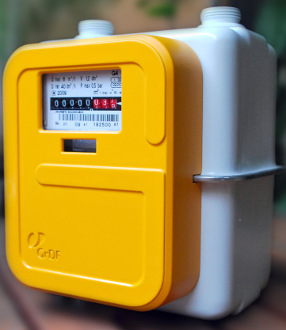
The smart gas meter is called Gazpar and is controversial too (obviously!). The transmission of information is slightly different. First it is only one-way and for reading: Nothing can be done remotely. Reading are transmitted by FM then mobile network twice a day.
It is like a old "dumb" meter clad in an bright orange cuirass.
For me the main issue is the loss of the magnetic pulse reading. I actually suspect that is is used internally by the Gazpar electronics but it is no longer available for personal use.
There is a "socket" but I can't find much information about how to use it (dry contact? Not so sure specially that the battery should last 20 years and in theory the fact that something is plugged in is sent to gas provider) and I am rather shy to try anything. If someone has any information about it... Please contact me.
Le compteur gazpar est équipé d'une prise. Cependant quasiment aucune information à ce sujet n'est disponible. Cela pourrait être un contact sec mais j'ai du mal à croire qu'il s'agisse d'un relais (avec une pile qui doit durer 20 ans et du fait que l'utilisation/occupation de la prise semble faire partie des informations remontées). Je suis preneur de toute information à ce sujet... Merci d'avance.
EDIT (16/12/2018):
The cable is for sale on (at least) two online shops. By the time you add VAT and postage, it's almost 20€ or 24€ (horrendous for what it is) but let's hope the price will go down with time.
Regarding how it is connected internally, I still haven't been able to find any documents but my best guess is that there are 2 reed switches bundled together, one used for the internal counter, the other one directly connected to the socket.
Having set up a sensor for both gas and electricity, the next step for me was to store the data.
There are countless solutions available for this either local or remote ("in the Cloud").
Probably the most famous one is Xively (which used to be COSM and before that Pachube). Trouble is they went really commercial without any offers for small projects. I tried a few alternatives but decided that I didn't want to publish my data and therefore turned to a local solution.
There are loads of possibilities for data storage, from the classical SQL solutions (MySQL, SQLite, ...), NOSQL solutions. A system which is gaining popularity is Graphite and its Whisper database. In the end, I decided to go for the simplest and probably most used database in the world of monitoring: RRD.
RRD
Almost all opensource monitoring and reporting tools on this planet use RRD. It has a big avantage, the database never ever grows! You lose the details (and even the data) over time but with the right setting this wasn't an issue.
For me, its biggest drawback is that (except with Datastores as 'Gauge') EVERYTHING IS A RATE PER SECOND.
Some calculation is necessary first to convert the pulses into actual usage, then into a rate and when displaying into a meaningfull usage figure.
Gas
Counting
1 pulse = 10 dm3 = 10 litres
Easy... Well how do I store this?
First let's chop the time into 5 minute slots (this the usual base for RRD BTW) and let's count the pulses within a slot. At the end of the slot, one can push the number of litres:
rrdtoolupdategas.rrd1407153600:100
Displaying
Internally, RRD will not store the value 100 but 0.3333333333 because it is 100 per 5 min or 100 per 300 sec.
When consolidating (to a 30 min = 1800 sec period), RRD will average all the rates.
If I want to display the gas usage over a given period (5 min, 30 min, 1 day), I then need to multiply the value returned by the length of this period. Resp. 300, 1800, *86400.
A lot of people convert the values into Watt-Hour. Unfortunately the conversion is NOT straightforward and depends on a Correction Factor you can only discover a posteriori on your bill or if lucky on your provider website like this one. Cubic meters are OK for me.
Power (rate): litre/s
Energy: m3 per period
Electricity
Counting
1 pulse = 1 rotation = 3.6 Wh
Like for Gas, we slice the time into the same 5 minutes slots and count the pulses within a slot. But remember that RRD stores rates per seconds. So to make sense we have to convert the Watt-Hour in Watt-Second:
1 Wh = 3600 Ws
3.6 Wh = 12960 Ws
Hence 1 rotation of the disk equals 12960 Ws. RRD will automatically store the value in Watts!
Displaying
Power: Watt
Energy: Wh for display per period
RRA
As mentioned before, RRD stores the data in a way which means the values will be aggregated over time and you'll loose the original individual values. After thinking a lot about what to do and how to handle it, I settled for the following pattern:
A lot of solutions (specially American & British ones) use current transformers clipped straight on to either the live or neutral wire. These can give real-time and very accurate readings. Trouble is, on french installations, both wires are usually combined together in a outer plastic sheath and in the "worst" case not even visible at any point!
Playing within the fuse box not being a great option the only remaining possibility was to "read" the meter itself.
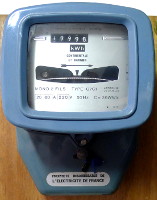
All modernish counter have at least impulse (usually a LED) output. Some more recent even have a "teleinformation" serial communication system, not even talking about the latest generation of smart meter with a USB port).
Mine is a very old rotating disk without any kind of bells and wistles... in short the worst case scenario.
After a bit of research I found what could potentially be the needed part: Fludia FM250. Unfortunately it doesn't seem to exist anywhere else.
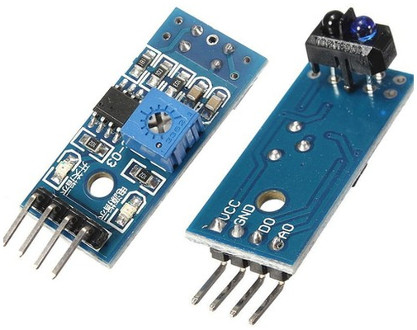
Knowning that my meter could be upgraded at anytime by the electricity provider, I wanted to stay on a cheap and low key solution. Some people on Jeelabs forums mentioned the TCRT5000 also saying that they didn't have much luck!
But googling this reference leads to IR Sensor TCRT5000 for Arduino as well as a TCRT - Infra Red reflectivity sensor + break out board from Ciseco which mention on their website "Revolving or tumblimg numbered Electricity meters".
Having found a "Infra-red reflective distance sensor Module tracing line" (basically a TCRT5000 + LM393) on eBay for a grand total of 6€, I decided to give it a go.
Never give-up!
To cut the story short... it works! I tried first in 5V then in 3.3V and in both case the black line could be detected but...
The alignment with the wheel is a real pain
Hooking physically the circuit on the meter box is also a real pain
Tuning the detection level is tricky
The temporary setup (made of cardboard and sellotape/scotch tape) has been in place for quite a while but I will need to find a better system before the next meter reading by the company.
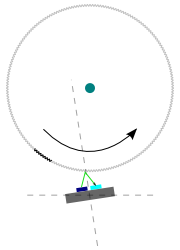
It is worth mentioning that the detection is better (or simply working) when the sensor is installed at an angle as illustrated below.
Crashing
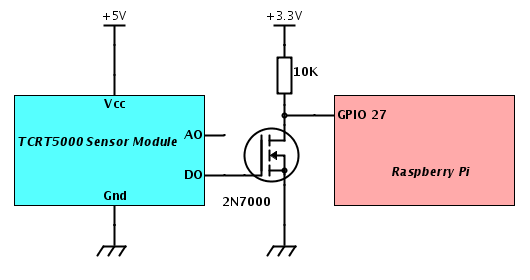
I noticed that sometimes the LM393 (part of the module) crashed and stopped detecting the black zone. It seems that the component doesn't like having its output forced to a voltage. When the Raspberry Pi boots, there is no garantee that the GPIO will be in INPUT mode and voltage free. So, to separate the two, I inserted a transistor (a 2N7000 I had in stock but it should be similar with a NPN). Moreover, it gives the possibility of using 5V for the sensor as if 3.3V should work, in practice it is relatively unstable.
And counting...
The counting set-up on the Raspberry Pi is the same as the gas one. That said, there is also a form of bounce (not mechanical but the result is the same) and so far I haven't managed to completely get rid of it, specially when there are bogus pulses a few seconds apart. I capped (like for the gas) the delay between pulses but this potentially means that I loose accuracy when the disk is spinning very fast.
So accuracy might not be that great but so far it still gives a pretty good picture of the electricity usage and with such a cheap design, it doesn't really bother me.